Mapping Lead Poisoning
This section details childhood lead poisoning among tested children by Census Tract in Syracuse. The map below shows the percent of children identified with elevated blood lead (EBL) in each Census Tract, out of the total number of children tested for lead in that specified Census Tract.
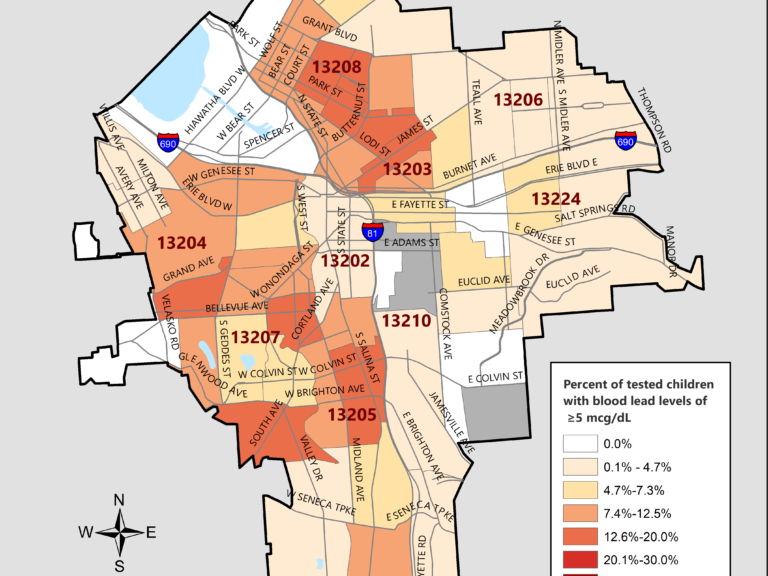
Blood Lead Level by Area Map
Please note that families with children with elevated lead levels may move or change their address during the calendar year. The map below reflects the child’s address provided at the time of lead testing. If a child was tested more than once in a calendar year, the child’s address at the time of their highest venipuncture (blood drawn from the vein) result will be used to create the map. If no venipuncture was performed, the address at the time of the highest finger stick result will be used. It is important to note that the child’s address at time of testing is not always the same address where the child was exposed to lead.
Data Sets:
• Elevated Blood Lead Levels Among Tested Children by Census Tract, Syracuse, NY, 2013-2019
• Elevated Blood Lead Levels Among Tested Children by Census Tract, Onondaga County, 2020-2025
Census Tract data maps from prior years are available upon request. Please email LeadFreeKids@ongov.net.